How Many Weeks in a Lifetime: Figures by Lifespan
Find how many weeks in a lifetime for common lifespans, and see how UN and CDC life expectancy data change the answer.
In this article
- Weeks in a Lifetime at Common Lifespans
- A remaining-weeks example
- How the Week Count Is Calculated
- Calculate a chosen lifespan
- Why calculators disagree slightly
- Real Life Expectancy Figures in Weeks
- Choose a relevant comparison
- Why the Answer Is an Estimate
- Three different uncertainties
- Healthy Weeks Versus Total Weeks
- Think in layers, not a single countdown
- Putting a Lifetime of Weeks in Perspective
- Follow a life through the jar
- Track Your Weeks and Plan the Ones Ahead
- Build a manual version
- Turn the overview into a decision
A global lifetime of 73.3 years is about 3,812 weeks, while a US lifetime of 79.0 years is about 4,108 weeks. The answer depends on lifespan, and on whether you're counting calendar time or translating a population average into weeks.
Those totals are useful starting points, but they aren't personal deadlines. To understand how many weeks in a lifetime means for you, separate three questions: how the arithmetic works, what life expectancy measures, and how you want to use a number that can't predict your future.
Weeks in a Lifetime at Common Lifespans
There's no universal lifetime total. For a lifespan you choose, however, the calculation is straightforward: multiply its length in years by the average number of weeks per year.
Approximate weeks in a lifetime by lifespan
The following are worked calendar conversions, using the rounded multiplier of 52.18 weeks per year. They're scenarios, not estimates of anyone's likely lifespan.
| Lifespan | Years | Approximate weeks |
|---|---|---|
| Age 50 | 50 | 2,609 |
| Age 60 | 60 | 3,131 |
| Age 70 | 70 | 3,653 |
| Age 80 | 80 | 4,174 |
| Age 90 | 90 | 4,696 |
| Age 100 | 100 | 5,218 |
Find the row closest to the lifespan you want to consider. Read its week count as the total from birth, not the time remaining from today.
A remaining-weeks example
Say you're 30 years old and want to explore an 80-year planning horizon. In that hypothetical scenario, you have 50 years between your current age and the selected endpoint.
Using the table's method, that's 50 × 52.18 = 2,609 weeks. The calculation answers a conditional question: how much time would remain if you lived to that age?
Planning rule: Choose the endpoint deliberately. A lifespan you select for an exercise isn't the same thing as a demographic estimate.
You can also compare several rows rather than commit to one. That makes the table useful for considering different futures without implying that any particular future is guaranteed.
Small differences between this table and familiar lifetime figures usually come from the conversion method. Rounding years to whole weeks is convenient, but it isn't quite the same as counting calendar days.
How the Week Count Is Calculated
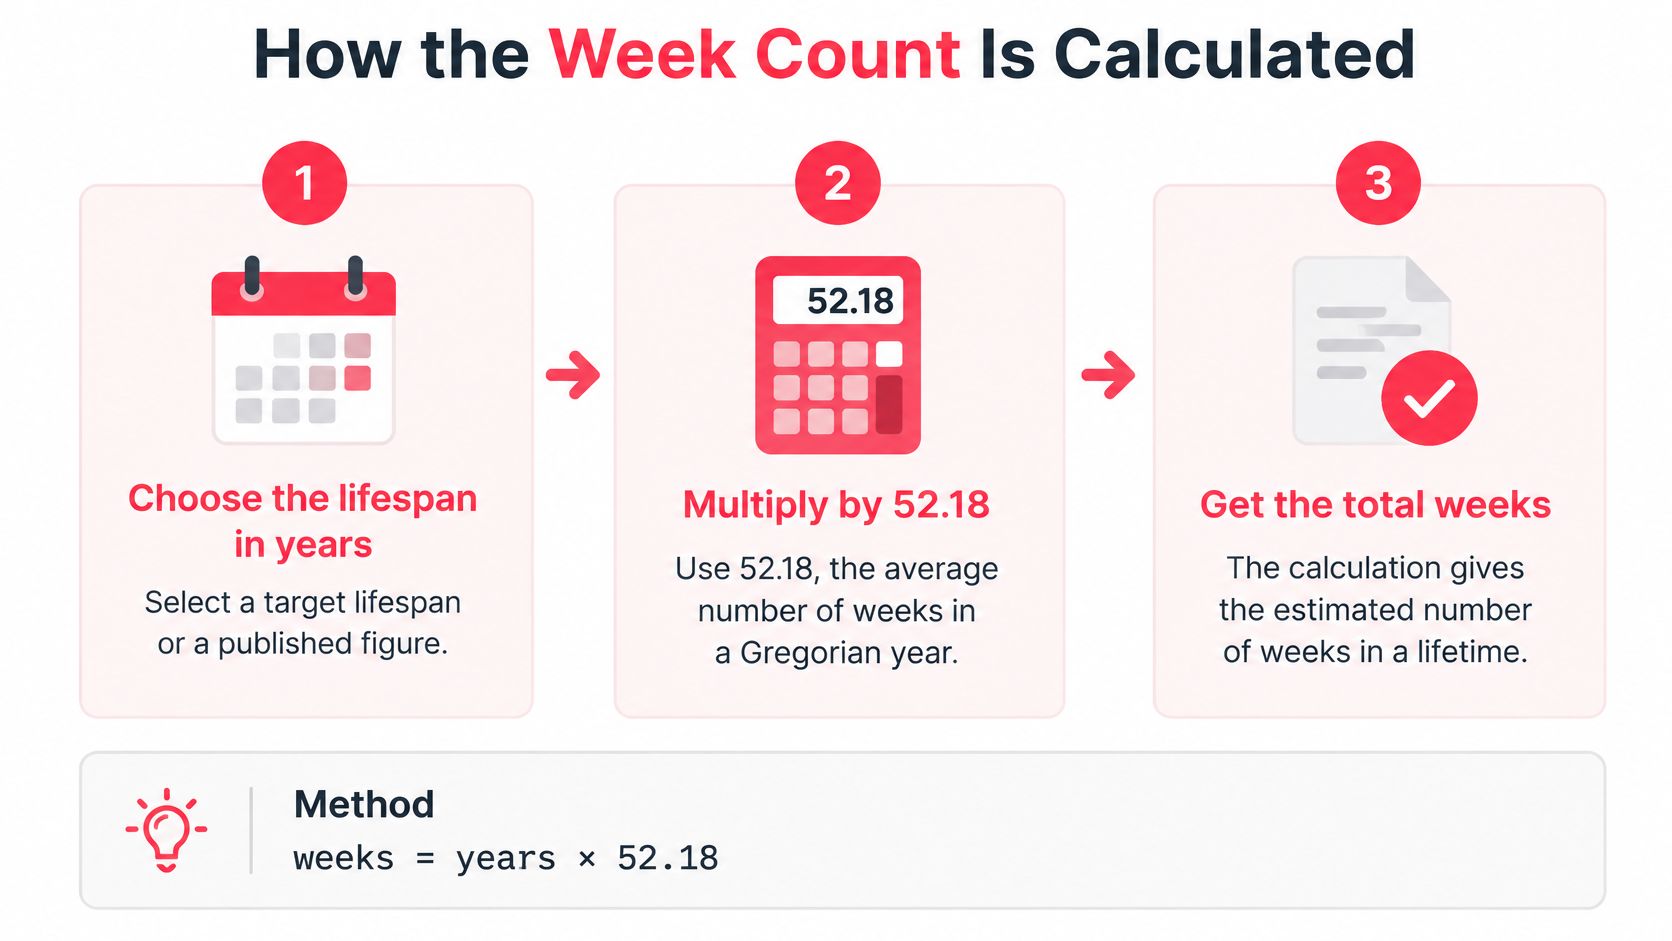
Weeks = years × 52.18 is a practical calendar conversion. A Gregorian year averages approximately 365.24 days, and dividing by the days in a week gives roughly 52.18 weeks.
The demographic anchor is separate: the United Nations World Population Prospects 2024 summary estimates global life expectancy at birth at 73.3 years in 2024, approximately 3,812 weeks using the simpler multiplier, and projects 77.4 years by 2054, approximately 4,025 weeks.
Calculate a chosen lifespan
- Choose the lifespan in years. Use either a hypothetical planning age or a published life expectancy figure. Label your choice so a reader knows whether it's an assumption or a population measure.
- Multiply by 52.18. This allows for the part of a calendar year that a whole-week shortcut leaves out.
- Round the result to a whole week. Retaining decimal places rarely adds useful meaning to a lifetime visualization.
- Include partial years. In a worked example, half a year contributes about 26 weeks rather than disappearing from the calculation.
The visual method is simple:
Why calculators disagree slightly
Using the global figure as a worked example, multiplying 73.3 by 52 gives about 3,812 weeks. Multiplying it by 52.18 gives about 3,825 weeks, a difference of roughly 13 weeks.
Neither calculation changes the underlying life expectancy estimate. They express the same number of years at different levels of calendar precision.
For a quick check, your answer should be close to the lifespan multiplied by the whole-week shortcut. For elapsed time between actual dates, count the days between those dates and divide into weeks instead. More precise arithmetic doesn't make an uncertain lifespan more predictable.
Real Life Expectancy Figures in Weeks
Life expectancy at birth is a population measure, not a prediction for a named newborn. More precisely, a period life expectancy figure describes how long a hypothetical newborn would live if the mortality rates measured for that period applied throughout life.
That distinction matters. It isn't the eventual average age at death of everyone born that year, because their future mortality conditions aren't yet known.
Life expectancy at birth converted to weeks
These reference figures use the approximate whole-week shortcut rather than the calendar multiplier used in the worked examples.
| Reference | Life expectancy in years | Approximate weeks | Year |
|---|---|---|---|
| Global average, WHO | 71.4 | 3,713 | 2021 |
| Global average, UN | 73.3 | 3,812 | 2024 |
| Global projection, UN | 77.4 | 4,025 | 2054 |
| United States, all, CDC | 79.0 | 4,108 | 2024 |
| United States, males, CDC | 76.5 | 3,978 | 2024 |
| United States, females, CDC | 81.4 | 4,233 | 2024 |
For the US population overall, the CDC's National Center for Health Statistics reports 2024 life expectancy at birth of 79.0 years, equivalent to approximately 4,108 weeks, in its publication released in 2026.
The CDC's sex-specific life expectancy figures, also published in 2026, put 2024 US male life expectancy at 76.5 years, about 3,978 weeks, and female life expectancy at 81.4 years, about 4,233 weeks. Subtracting those figures gives a population gap of 4.9 years, approximately 255 weeks.
Choose a relevant comparison
- Match the population. A country-specific estimate is more relevant to a country-specific question than a global average.
- Check the reference year. The year being measured and the publication year aren't necessarily the same.
- Distinguish observations from projections. A projected future estimate rests on assumptions about mortality that haven't yet occurred.
If you want to estimate time remaining at your current age, seek life expectancy at that age, rather than subtracting your age from life expectancy at birth. Having already survived to adulthood changes the statistical question. A birth-based figure remains useful context, but it isn't a personalized remaining-time calculator.
Why the Answer Is an Estimate
The assumption that everyone has the same lifetime allowance fails when population conditions change. The World Health Organization reported in 2024 that global life expectancy at birth fell to 71.4 years in 2021, equivalent to approximately 3,713 weeks.
That pandemic-era figure shows why a lifetime count shouldn't be treated as a permanent constant. An estimate describes mortality conditions, and those conditions can change.
Three different uncertainties
Location changes the comparison population. A worldwide average combines populations with different mortality patterns. Applying it to yourself doesn't account for the circumstances of your country or community.
Time changes the assumptions. People born in different periods encounter different health conditions over their lives. A projection attempts to account for future change, but it remains conditional on its assumptions.
Individual outcomes differ from averages. Even a well-matched population estimate can't tell you when your own life will end. A population average summarizes variation rather than removing it.
A lifetime estimate is a reference point for thinking, not a date to put in your calendar.
There's also a distinction between measurement precision and forecast uncertainty. Counting elapsed weeks from your birthday can be precise because those dates are known. Estimating weeks ahead can't become equally precise merely by displaying more digits.
For personal planning, use several explicitly chosen lifespan scenarios instead of a single asserted endpoint. Keep the arithmetic consistent across them and revise the demographic reference when a newer relevant estimate becomes available.
You don't need to decide which scenario will come true. The useful question is whether a decision still makes sense across different possible futures, rather than only under the most reassuring one.
Healthy Weeks Versus Total Weeks
Years alive aren't the same as years lived in full health. The World Health Organization's healthy life expectancy indicator measures expected years in “full health,” adjusted for illness and injury; it also reports that pandemic-associated anxiety and depression reduced global healthy life expectancy by six weeks.
That adjustment isn't a countdown to someone's first illness. Healthy life expectancy summarizes health loss across a population, so it shouldn't be interpreted as a block of entirely healthy time followed by an entirely unhealthy final period.
Think in layers, not a single countdown
- Total projected weeks describe an assumed or statistically estimated lifespan.
- Healthy-life weeks add a population-level view of health, without identifying which particular weeks will involve illness.
- Elapsed weeks are the time you've already lived, including experiences that don't fit neatly into healthy or unhealthy categories.
For a broader discussion of the distinction between duration and health, the resource on optimizing healthspan with OneTwenty offers a complementary way to think about healthspan versus lifespan. Treat that distinction as a planning lens, not a promise that anyone can control their future health.
A weekly record can make room for context that a total alone leaves out. Notes might describe recovery, chronic symptoms, caregiving, or an ordinary enjoyable day during a difficult period. A mood tracking chart can provide a structure for recording how a week felt, without turning those entries into a medical forecast.
A humane interpretation: A week affected by illness is still a week of someone's life, not a failed unit of productivity.
The practical conclusion isn't to rank every week by health or achievement. It's to avoid assuming that all future time will offer identical possibilities, while refusing to treat disability, dependence, grief, or recovery as time without meaning.
What would you want to remember about a difficult week, beyond the fact that it was difficult?
Putting a Lifetime of Weeks in Perspective
Suppose a jar holds 4,000 marbles, each representing a week in an imagined life. Removing a marble as each week passes makes duration visible, although the jar's starting quantity is a chosen illustration, not a personal forecast.
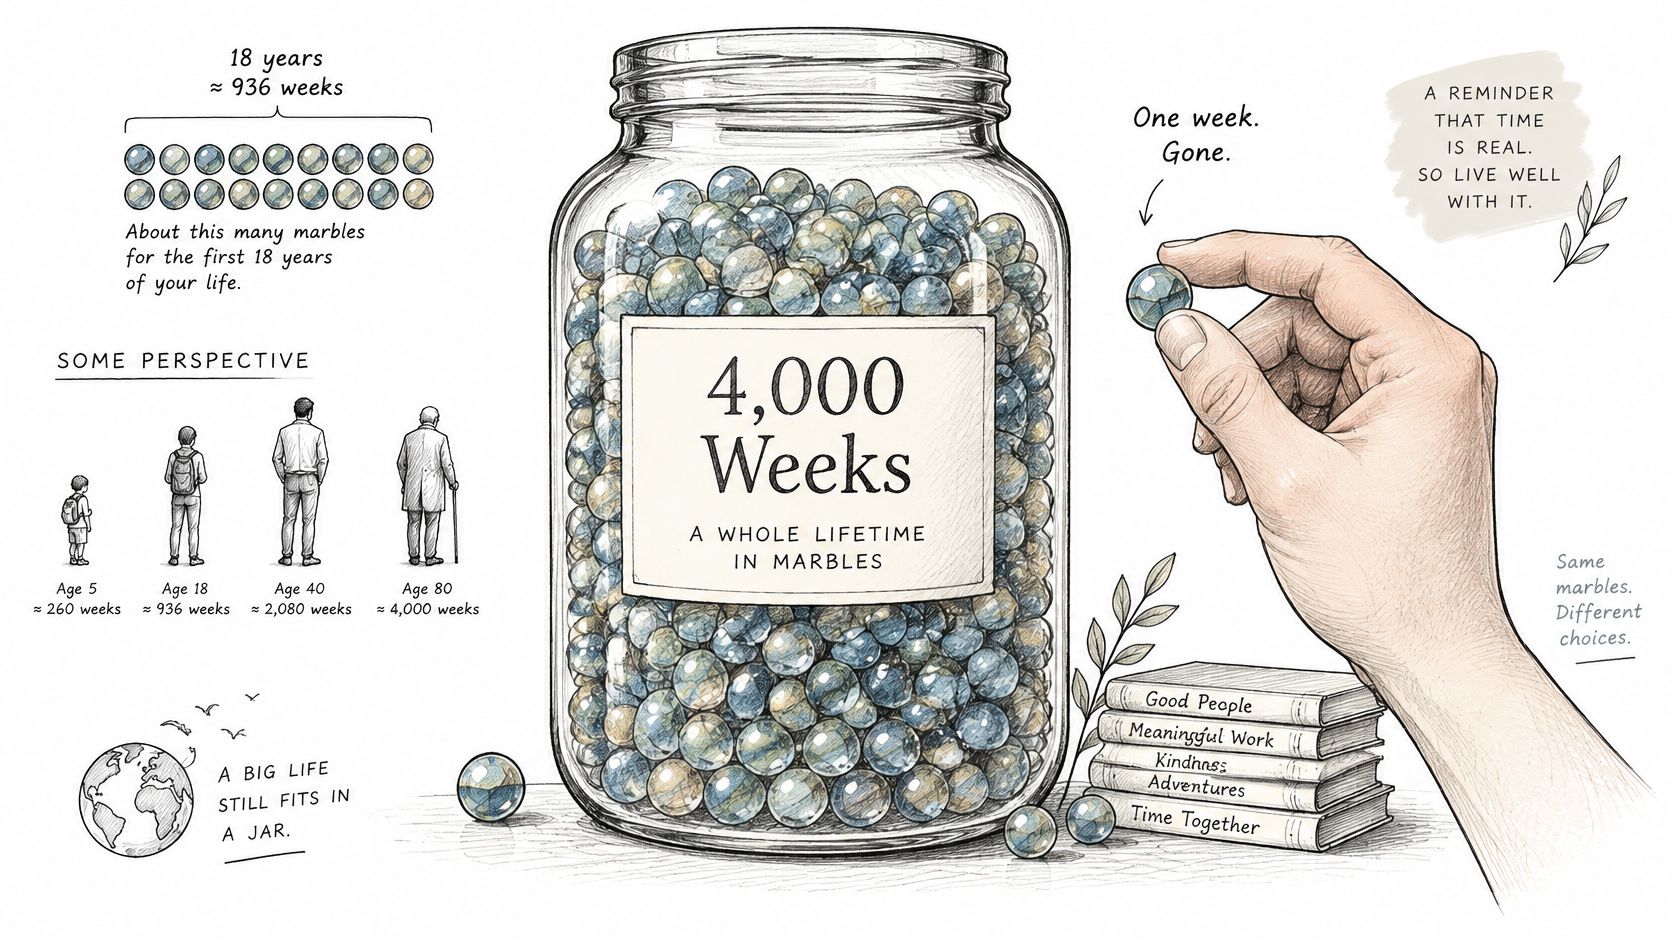
The analogy has a limitation: the marbles look interchangeable. Actual weeks aren't. A childhood holiday, a move, a period of caregiving, and an uneventful stretch at home may occupy equal space on a grid without having equal significance to you.
Follow a life through the jar
Consider a hypothetical reader in their late thirties. They can identify childhood, education, work, relationships, and changes of home in the part of the jar already used. They can't name the contents of the remaining part.
- Childhood has recognizable chapters. A photograph or school memory can distinguish a period that would otherwise appear as an undifferentiated run of boxes.
- Weekends provide a familiar rhythm. They make weekly time easier to imagine, though not everyone has weekends free from work or care.
- Later life remains unwritten. Empty space represents possibility and uncertainty, not guaranteed leisure or a list of obligations.
Instead of seeing only what has passed, you can add detail to it. These visual journal ideas offer ways to combine images and written memories so a timeline records experiences rather than just duration.
The most revealing comparison may be between a full-looking past and an empty-looking future. The past appears detailed because you know what happened. The future appears blank because you don't, not because it lacks potential meaning.
What would you like the next stretch of your timeline to contain?
Track Your Weeks and Plan the Ones Ahead
A life grid gives each week a box. You can use it as a broad overview, then attach a record to the weeks you want to remember. Its value isn't that it reveals a hidden deadline, but that it puts individual experiences into a consistent time frame.
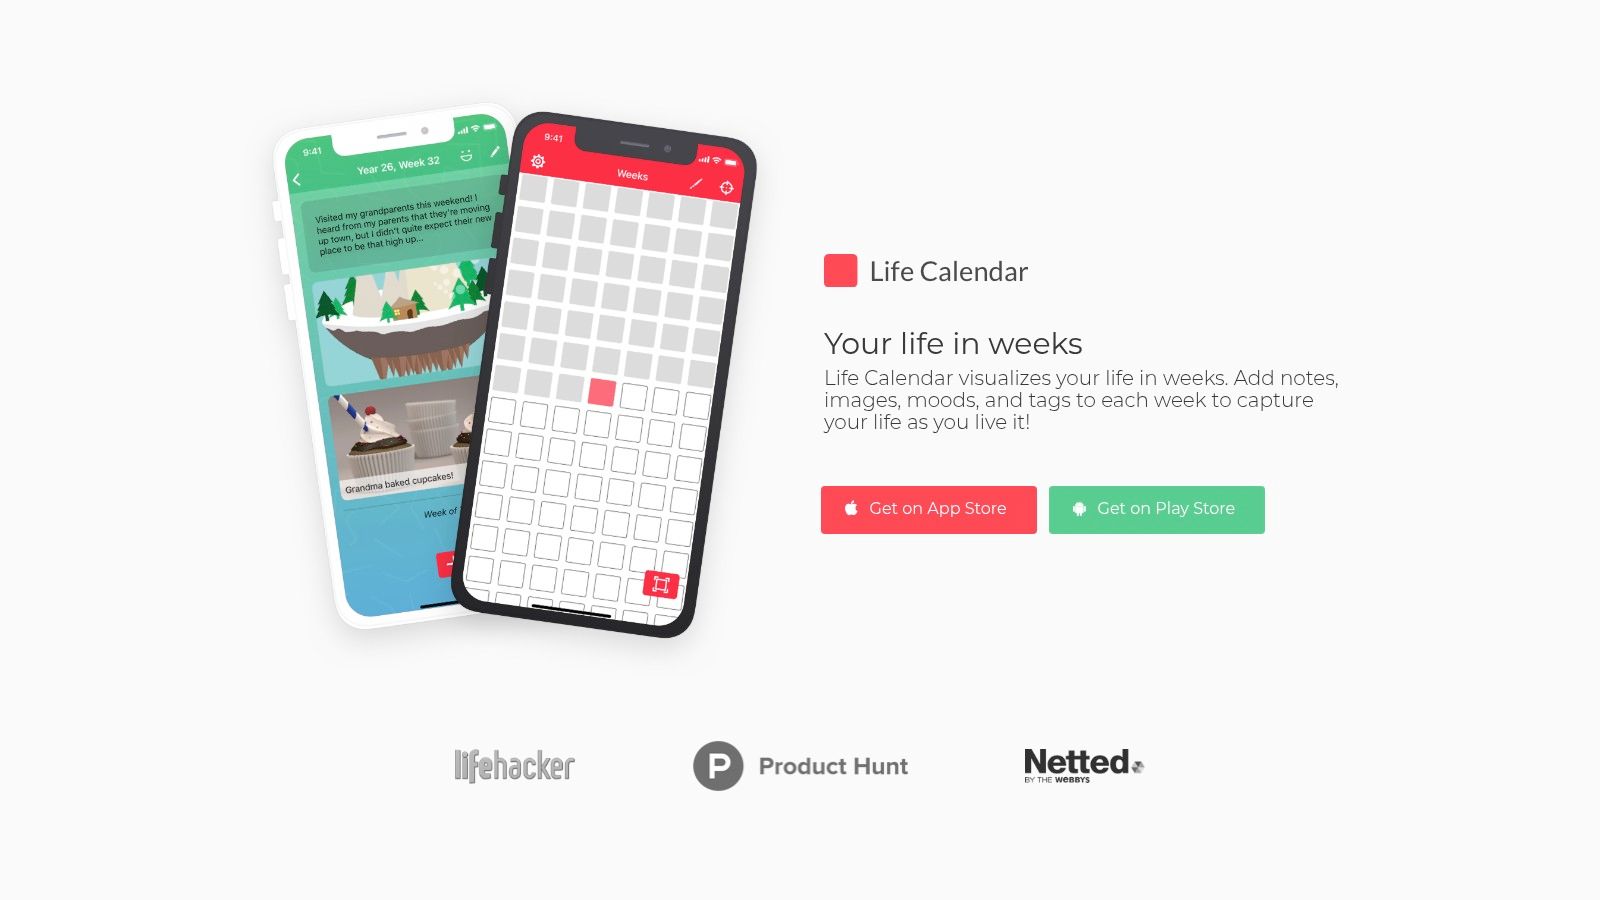
Our life calendar app uses your birthday to generate this grid, with each week shown as a box. You can choose a weekly view showing all weeks together or a yearly view that breaks weeks into years, and add notes, images, moods, and tags to document particular periods.
The overview connects the scale of a lifetime to individual weekly records:
Build a manual version
A spreadsheet, graph paper, or drawing application can serve the same basic visualization exercise. Decide whether you want a compact symbolic grid or a date-based record, because those serve slightly different purposes.
- Establish your starting date. Use your birthday and count completed weeks up to today. Keep the current, incomplete week separate.
- Choose a planning horizon. Label it as an assumption rather than as your expected age at death.
- Draw and shade the grid. If you use whole-week rows to represent years, acknowledge the small calendar mismatch rather than presenting the diagram as date-exact.
- Mark your current position. A pointer separates completed time from the space you're using to consider the future.
- Add selective detail. Record a milestone, an ordinary memory, or a period you don't want to lose track of.
Don't feel obliged to reconstruct every week of your past. Begin with dated photographs, calendar entries, and events you can place confidently. Where memory is uncertain, label a broader period instead of inventing a precise date.
Turn the overview into a decision
First, decide what question you want the grid to answer. Remembering experiences calls for notes and images. Considering future commitments calls for a clearly labeled planning horizon. Understanding population longevity calls for a relevant demographic measure.
Next, separate completed, current, and hypothetical future time. If you calculate a remaining total, subtract elapsed weeks from your chosen scenario using a consistent method. Keep the result conditional.
Then choose what deserves an entry or a protected place in your plans. That might be time with family, a health appointment, a creative project, or space without a scheduled task. You don't need to assign a purpose to every empty box.
For our calendar, you can export a copy from the Weeks view by zooming out and selecting the Share button in the navigation bar. Keep the exported copy as a snapshot or print it for a physical reference.
A grid can hold both an honest record and an open future. Use the estimate to support choices, not to pretend the future has already been counted.
Life Calendar turns your birthday into a weekly overview and lets you record the experiences behind the boxes with notes, images, moods, and tags. Visit Life Calendar to create your grid, mark where you are today, and document a week you want to remember.