Mood Tracking Chart: How to Build One That Works
Learn how to build a mood tracking chart with a simple scale, weekly context and clear review habits that reveal real patterns over time.

In this article
- Mood Tracking Chart Template and Scale Anchors
- One Filled Row
- Choosing a Daily, Weekly or Mixed Cadence
- The Mixed Rhythm in Practice
- How to Build Your Chart Step by Step
- The Eight Steps
- Turning Weekly Entries Into a Readable Trend
- The Three Entry Problem
- Reading Patterns Without Overreading Them
- Annotate, Then Ask Two Questions
- Keeping the Chart Going Without Burnout
- Signs You Should Pause
- Start Your Chart This Week
You know February felt rough, but you can't say whether it was worse than January, or when it turned. Memory keeps the worst day and blurs the rest.
A mood tracking chart fixes that only if it stays honest. You need fixed scale anchors, a cadence you'll keep, and a rule for missing days. Without those, you're colouring in boxes, not building a record you can read back.
Mood Tracking Chart Template and Scale Anchors
Start with five columns and nothing else: date, mood score from 1 to 10, energy, one context word, and a short note. Energy is low, medium or high. Context is a single word such as sleep, work or family. Keep the note to 20 words or fewer.
One Filled Row
Say your row reads: Tuesday 14 March, mood 6, energy medium, context "short sleep", note "coffee with a friend helped". That took seconds, and a month from now you'll still know what the day looked like. It also matters why you picked 6 rather than 4 or 8, which is where anchors come in.
| Score | Anchor | Typical day |
|---|---|---|
| 1-2 | Very low | Hard to get through the day; withdrawn or heavy |
| 3-4 | Low | Flat, irritable or anxious; going through the motions |
| 5 | Neutral | Ordinary day with nothing standing out |
| 6-7 | Good | Steady, some enjoyment, manageable stress |
| 8-9 | High | Upbeat, energised, engaged with people and tasks |
| 10 | Peak | Rare, exceptional day; keep for true highs |
Use these anchors for your first week, then rewrite them in your own words. Your version of a 4 might be "got everything done, enjoyed none of it". That phrasing will mean more to you than anyone else's template.
If your mood shifts with your cycle, look at the templates for tracking hormonal mood shifts from Lila for ideas on adding one context field without rebuilding the chart. One extra field is enough.
What makes the chart readable isn't cleverness. It's that a 6 on Monday means the same as a 6 on Friday. Change what a 5 means halfway through a month and the trend is gone, because you're comparing two different scales.
Working rule: One score per entry, whole numbers only. If a day doesn't fit the anchors, score it anyway and say why in the note.
Choosing a Daily, Weekly or Mixed Cadence
Choose by the question you need the chart to answer: triggers need day resolution, while a life overview can survive one honest mark per week.
| Cadence | Best for | Time cost | Main risk |
|---|---|---|---|
| Daily (one score and one note) | Spotting short swings and triggers | About 30 seconds a day | Gaps on busy days |
| Weekly (one score for the week) | Life overview and long trends | About 5 minutes a week | Memory bias blurs bad days |
| Mixed (daily score, weekly review) | A first month with both detail and review | About 30 seconds a day plus 10 minutes a week | The weekly review gets skipped |
Daily suits you if you want to spot triggers, because short swings disappear from a weekly summary. Weekly suits you if you want a life overview and do not care which day was worst; if a bad Tuesday gets reconstructed on Sunday, the chart becomes an impression. Mixed suits you if you are unsure, and it is what I would start with.
Reporting guidance in Translational Psychiatry notes that weekly ratings commonly use validated measures such as QIDS or ASRM, while shorter daily reports are often preferred by users; the same guidance puts compliance in published smartphone EMA studies at 49% to 95%, with broader evidence suggesting an average near 79%.
Compliance is the constraint. Set missing-data rules before the first gap: leave a missed day blank, catch up a weekly score only within that same week, and mark any late entry "estimated". A rough plan kept for three months shows a shape; a detailed plan abandoned in week two shows none.
The Mixed Rhythm in Practice
Score once a day, at the same time, with one note. Once a week, sit down for 10 minutes and read the seven entries together. Add one context line for the week and one sentence about what changed. Keep cause separate: write "after late nights" only if the entries already show it, otherwise record the cluster and test it next week. Treat the time costs as estimates and check them against your own week after a fortnight.
Pick the rhythm you will still be doing in six weeks.
How to Build Your Chart Step by Step
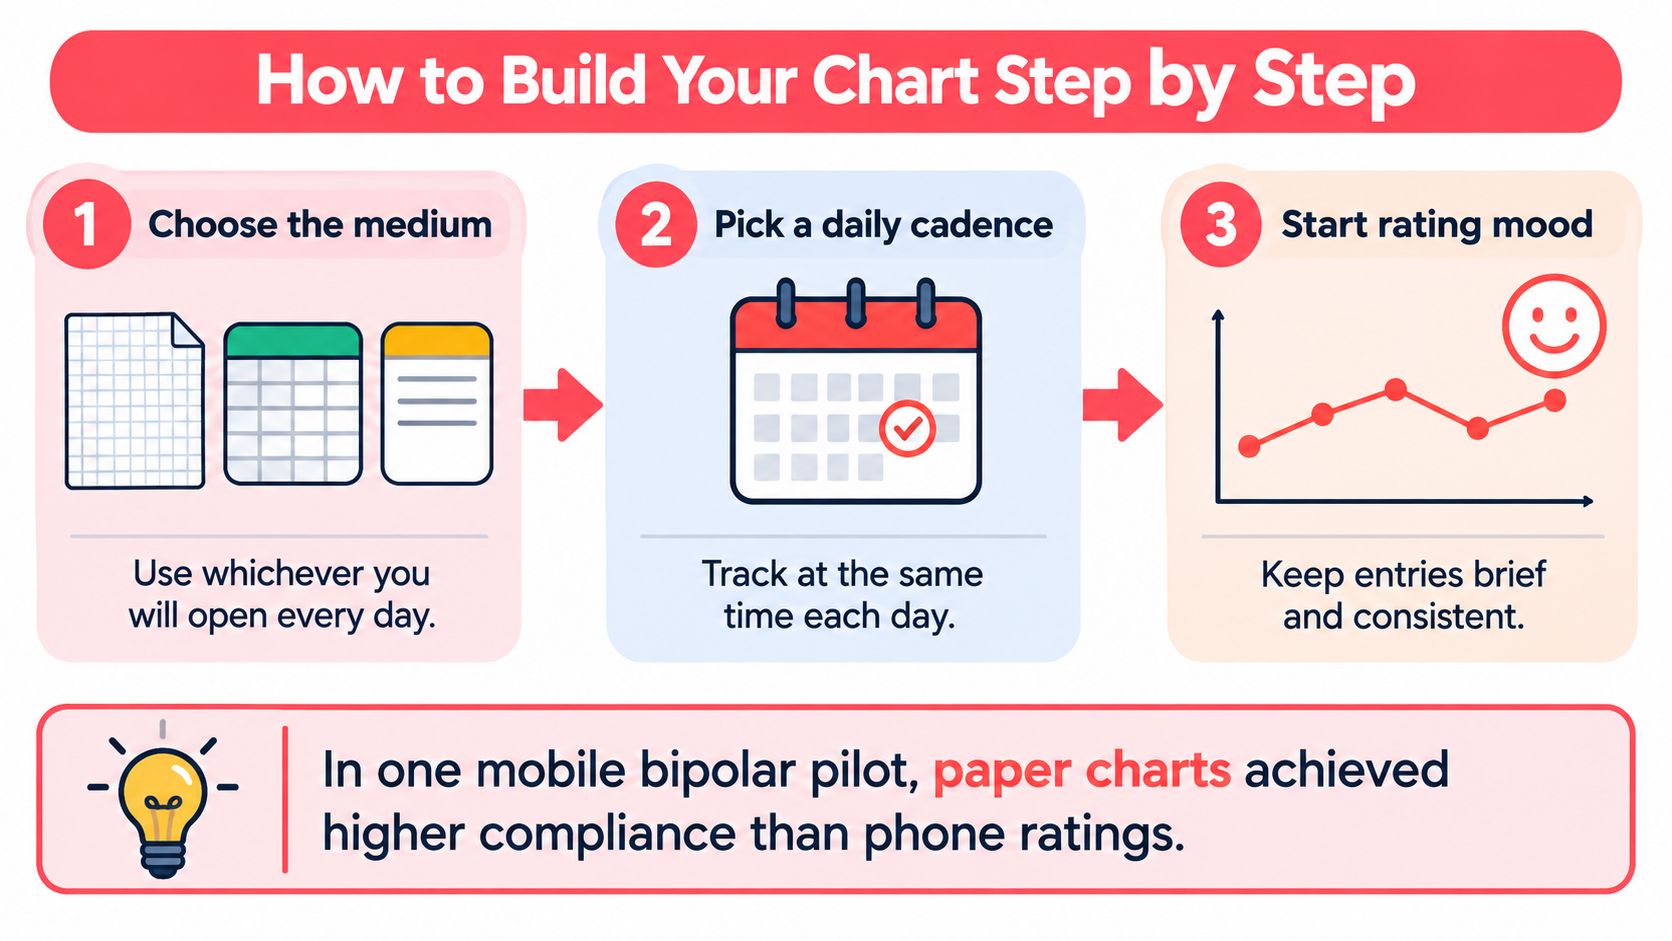
Charts like this predate the apps. As the overview of visual analogue scales in the KKU research journal notes, visual analogue scales were introduced for subjective assessment in the early 1920s, and the Bond-Lader mood scale uses 16 horizontal 10-centimeter lines built from opposing descriptors such as happy and sad. The principle holds: mark a position on a fixed scale, repeat it, and the marks become comparable.
The Eight Steps
- Choose the medium. Paper grid, spreadsheet or notes app, whichever you'll open daily. Paper is a strong choice if screens put you off.
- Set the scale to 1 to 10 and paste your anchors where you can see them. Anchors are what keep a 6 in March meaning the same thing as a 6 in June.
- Use your chosen cadence. One row per day for detail, one row per week for the overview.
- Pick one context field, such as sleep, work, health or relationships, and record it as a single word. One extra field is enough. Every column you add is one more reason to skip the chart on a tired evening.
- Fix an entry time, such as before bed, and set a reminder with snooze. Scores logged at random hours rate different parts of the day. If you want the written side to go further, journaling with Refresh Psychiatry & Therapy is a useful companion to a one-line note.
- Record the first week without judging it. The common slip is quitting after three days because the scores look dull. Dull is data.
- Plot the scores as a line across the days, with your anchor bands as horizontal guides. Leave a visible gap where a day is missing rather than joining across it. A broken line is honest; a smoothed one hides the hole.
- At day 14, cut columns you never fill in. A shorter chart you complete beats a thorough one you skip.
That is the whole build. What makes it a chart rather than a diary is that every mark means the same thing, because the scale, the entry time and the context word stay fixed while the days change.
Turning Weekly Entries Into a Readable Trend
Keep the daily entries and build a weekly view on top of them. Don't replace seven scores with one number and throw the rest away.
| Weekly measure | What it shows | Display rule |
|---|---|---|
| Median score | Typical week, resists one outlier | Show when at least 4 of 7 entries exist |
| Mean score | Overall level, sensitive to extreme days | Show with the median, not alone |
| Standard deviation | How much the week swung | Flag weeks above a level set after a month of data |
| Completed entries | How complete the week is | Label weeks below 4 of 7 as partial |
| Change from baseline | This week minus your rolling 4-week average | Use for trends, not raw scores |
The median is your typical week, and it won't lurch because of one terrible day. The mean shows overall level but moves with extremes, so read the two together. Standard deviation tells you whether the week was steady or swinging, which a single median hides.
The Three Entry Problem
Say a week has three entries: 8, 2 and 7. The median is 7, and it looks like a good week. It isn't evidence of one. Three days can't carry a seven day claim, so label that week partial rather than hiding it or presenting it as complete.
That display rule comes from a mobile bipolar mood chart pilot in the Journal of Medical Internet Research, which supports showing a weekly score only when a predefined minimum such as 4 of 7 observations is met. Phone based ratings in that pilot averaged only 42.1% compliance, with a range of 4.8% to 93.0%, which is why low friction entry and reminders matter more than extra fields.
Compare each week with your own rolling four week baseline, not with anyone else's scores. People use the scale differently. Your 5 may be someone else's 7, so the useful question is whether you're above or below your own normal. A Life Calendar app view built around weeks shows how that weekly framing works in practice, with each week holding its own record inside the longer run.
Reading Patterns Without Overreading Them
Say you've had three low weeks in a row, and each one followed nights of poor sleep. It's tempting to conclude that sleep caused the dip. Don't, yet.
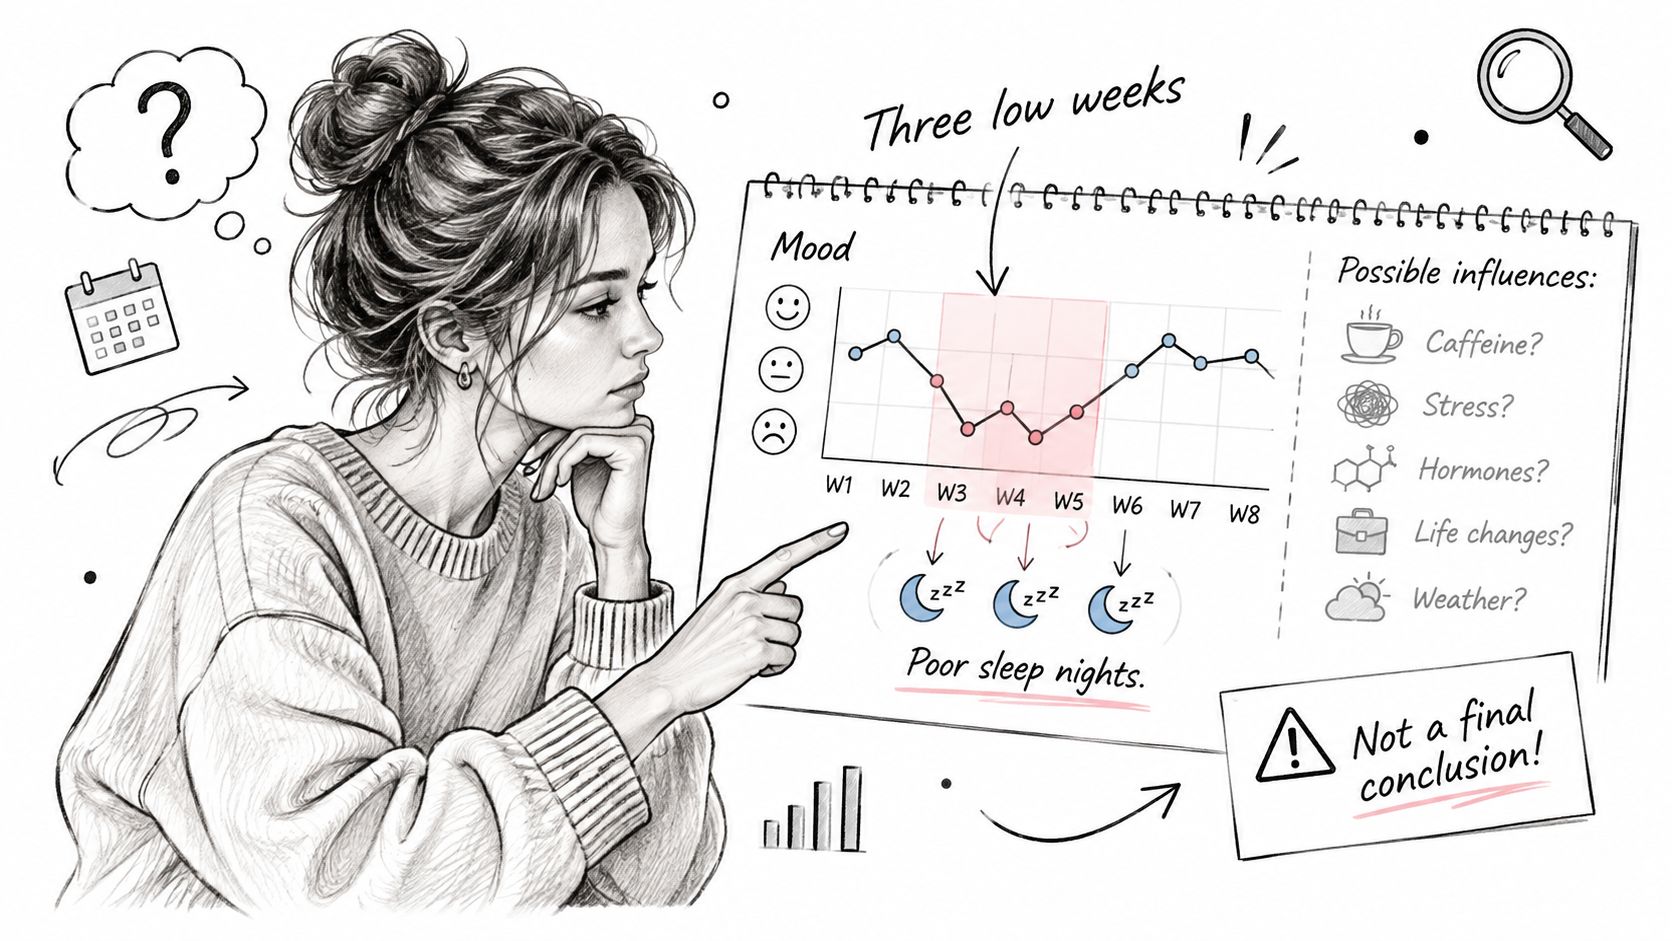
Those three weeks may also have held an illness, a work deadline, a family row or a seasonal shift. Poor sleep may be a symptom of the low mood rather than its cause. Your chart can show that two things happened together. It can't separate them.
That gap is the weak point of most tools. A review of mood monitoring apps in JMIR mHealth and uHealth found that users valued collecting and visualizing emotional data, but often received little guidance for translating patterns into meaningful conclusions or practical next steps. So the burden of honest reading sits with you, not the chart.
Annotate, Then Ask Two Questions
Write context beside each entry as you go: events, sleep, health, relationships and major changes. Retrofitting context later means guessing. If you're unsure how to phrase those brief entries, the guidance on how to write journal entries alongside a weekly record covers the mechanics of keeping them short and dated.
Then, at review time, ask two things:
- What changed before this shift? Look at the days leading up to the score moving, not the day itself.
- Does this pattern recur across several weeks? One coincidence is an anecdote. Four recurrences are worth a practical experiment, such as protecting two earlier nights and watching what happens.
A chart shows what happened. It doesn't show why it happened.
Treat every candidate explanation as a hypothesis, then test it cheaply. If you suspect late caffeine drags your score down, cut it for a fortnight and compare those weeks against your rolling baseline. If the line doesn't move, the hypothesis failed and you look elsewhere. That discipline is what separates a record from a story you talk yourself into.
Act when a pattern persists for several weeks, or when the direction worries you. Take the weekly summary to a clinician or a trusted person, because a dated record beats a vague recollection of a bad month. A mood tracking chart supports reflection and better questions. It doesn't diagnose anything, and the evidence on mood monitoring outcomes remains limited.
Safety comes before trend spotting. If a low stretch comes with thoughts of self-harm or a feeling of being unsafe, contact local emergency services or a crisis line straight away. Don't wait for another week of data.
Keeping the Chart Going Without Burnout
Most charts don't die from bad design. They die because the chart starts to feel like a test you're failing, and a missed week becomes the reason to stop.
Tracking isn't automatically harmless, and more frequent isn't automatically better. Apps built for mood tracking can have usability problems, and their adverse effects are still not well studied. That uncertainty is a reason to watch your own response to the chart, not a reason to avoid tracking altogether.
Entries get skipped most often when you're feeling especially well or especially unwell, and self-ratings are least reliable during severe episodes. Treat a gap as information, not failure. Your missing-data rule covers this: mark the week partial, write one line about what was happening, and carry on. A chart with honest gaps beats a chart abandoned in week nine.
Signs You Should Pause
- Rising anxiety about the score before you've even written it
- Self-judgment when a number comes out lower than you wanted
- Compulsive checking of the line several times a day
- Distress when an entry is missed, rather than mild annoyance
Two or more of these means drop to weekly, or stop for a fortnight. If monitoring keeps intensifying anxiety, talk to a professional about whether the chart is still helping.
Privacy deserves the same attention as the scale itself. Record only what you need, keep a device lock on, and learn how to export and delete your own data before you accumulate months of it. Think before sharing a chart that names other people. If you're comparing software, the roundup of the best journal app options for Android is a reasonable place to check export and deletion controls before you commit.
Start Your Chart This Week
- Build the chart from the five columns and anchors above, using the cadence you picked.
- Enter today's score, one context word and one note. Repeat for six more days, including the low scoring ones you'd rather skip.
- On review day, apply the weekly rules. Work out the median, check you have at least four entries, and write one sentence about what changed.
- Write down one question to raise with a clinician or trusted person if a pattern lasts several weeks.
- Review weekly for a month before deciding whether the chart helps you.
Life Calendar takes that same structure further. Users can mark each week with colours and add notes, images, mood and tags to it, inside a grid generated from their birthday with each week shown as a box. It can be viewed as a weekly grid showing all weeks in one grid, or as a yearly grid that breaks weeks into years.
Consistency beats detail.
Start with today's score, then give it somewhere to accumulate week by week so you can see the shape of a season rather than a single day. Visit Life Calendar to set up your life in weeks grid, mark each week with a mood, colour and note, and build the honest long view this chart is meant to produce.